JVM Tuning
 JVM Tuning
by John Mason
Date: 7/20/2006
This was a CFDJ Cover Article
As ColdFusion programmers or system administrators, there are times when
we go through the CF Admin interface to try and optimize the server. A
particular section located within the standalone version of the
ColdFusion Administrator is simply called Java and JVM. When
you reach this section, unless you have a healthy dose of Java
experience, you may scratch your head and think, “I don’t really know
much about this” and skip to something else. But the catch is, this
section is the most powerful and important area to look at.
It is common knowledge that Adobe’s ColdFusion runs on Java, but Java
runs on top of the Java Virtual Machine (commonly called the JVM or
VM). The JVM is what allows Java to speak to the physical machine and
controls processing and memory allocation. Because of this, changes to
the JVM settings can have a huge impact on how your ColdFusion
applications run. If you have already optimized your ColdFusion code
and settings: scoping variables, caching, etc., it may be time to take
a closer look at your JVM settings.
Java and JVM Administrator Section
If you are running the standalone version of ColdFusion MX, the Java
and JVM section of your ColdFusion Administrator is a very simplified
admin with which to view your JVM settings. If you are using the J2EE
configuration, this feature is not listed, but you can still access the
configuration file directly. Several important settings are shown
within the CF admin, including the important ones like the Heap size,
Permanent size and certain other JVM arguments. As you change or modify
these settings, the admin will modify the jvm.config file which is
usually located at either the “CFusionMX7\runtime\bin” or “JRUN4\bin
directories depending on your configuration. It will also save a
jvm.bak file, a backup file of the previous settings you had before
submitting your last set of changes. If you want to see all the
settings being used by your JVM, just look at the jvm.config file. An
important thing to keep in mind is that if you change the settings
directly on the jvm.config file, make certain to save a backup.
Some Basic Things to Know About the JVM
The JVM is a hardware abstraction layer that allows the Java language to run on just about any machine, whether it is a PC, Linux, Solaris, etc. It is written for each type of server and hardware platform. As a result, some do run faster than others and you can change the default JVM that ColdFusion comes with. We will be focusing on tuning the one you currently have installed.
Permanent Space
The JVM must have memory in order to function. One part of the machine’s memory is set for the JVM to reside in. This is called the Permanent space. The ColdFusion application server runs in this space as well. Some people think the Permanent space is a part of the heap space. It really is not and it has its own distinct purpose. The Permanent space holds items like the class objects that ColdFusion creates during compilation and runtime of templates.
The Heap Space
The memory used to store items such as variables is called the Heap space. The Heap space is actually divided up into smaller spaces called “generations”. There are several generations within the heap, but the few general areas we are most concerned with are called:
-Young (New) generation space
-which contains
a) Eden space
b) Survivor 0 space
c) Survivor 1 space
-Tenure (Old) generation space
The specific generation an object falls into is dependent on its age. Any “new born” memory objects that need to be placed into memory are always created in the Eden space first. When Eden fills up, the memory items that are still referenced or “alive” move to Survivor 0 and Eden is cleared out of any old objects that are no longer required by the JVM. This provides room for new incoming objects. When the Survivor 0 space fills up, once again the objects that are still “alive” are moved to Survivor 1 space and Survivor 0 is cleared out. If an object is needed for an extended period of time, it will move into the Tenure space and stay there until it dies. So, all objects in the JVM memory start off in the Eden space and will either die at some point or end up in the Tenure space. Naturally, you will want to see request-scope variables stay in the Eden space, session-scope variables, in one of the Survivor spaces, and application-scope variables in the Tenured space.
What is Garbage Collection?
The memory spaces are controlled by the JVM through what is called the “Garbage Collector” or “GC” for short. While it can sound relatively simplistic, Garbage collection is actually a very complex subject.
The garbage collector moves things around in the memory heap space and decides whether certain items need to be kept or discarded. If there were no garbage collection, the JVM would run out of memory within a very short period of time. The garbage collector either kills objects or moves them into an older generation space. It also changes the sizes of the spaces depending on your JVM settings and its needs. These are minor garbage collections and are needed for the JVM to run properly. But, as you might expect, over time the Tenure space might fill up. When this happens the system will run a full garbage collection and try to free up space. This is very intensive, and you do not want to see the system doing this full GC very often. If, for some reason when it runs a full GC and it can’t free up the memory, the JVM will crash, taking ColdFusion down with it. This is when you might start noticing java.lang.OutOfMemoryError errors appearing in your exception logs. On a browser, you might see a 500 error saying simply “Java heap space”.
If you are wondering why the JVM has so many memory spaces, it is because of the garbage collector. Early JVM versions had collectors that had to scan the entire memory space to do a garbage collection. This took up time and resources. By dividing up the space, the collector can run fast minor GCs and do full GCs only when it absolutely needs to. Under this setup, even the full GCs run faster. So it helps boost the performance.
When the garbage collector is at work, just about everything within the JVM is put on hold. Naturally, the JVM can’t have an application thread writing to a memory space that is being deleted by the collector. So the threads have to wait whenever the collector is in process. This is important because the collector could take a few milliseconds doing a minor GC or it could take a lot longer when doing a full GC to clear up the Tenured space. The speed and number of collectors depends a great deal on processor speed, heap size and the type of collector you are using. Therefore, you need to see what your garbage collector is doing.
How Do You Determine Your Current Heap Size Usage and Garbage Collection Time?
So,
how do you determine how much memory the JVM is currently using or how
well the garbage collector is running? There are several different
ways, but one of the easiest is to use is the JVMStat and Visual
Garbage Collector Tools from Sun (http://java.sun.com/performance/jvmstat/ ).
If you use a JVM that isn’t not from Sun, it should have its own
statistic tool that you can use. If you are trying to optimize your
ColdFusion server, I would highly recommend using these tools. They
will provide you the basic information you need to make the right
setting changes to your JVM.
Once you have
installed the tools on your machine, you will be able to pull up a
graphical representation of the heap space, permanent space and garbage
collector.
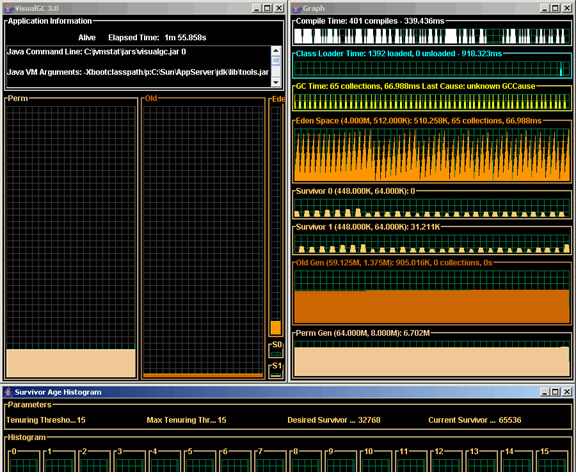
This will provide the most detail view of your JVM settings.
You now have some basic variables to look at.A few other things to take note of are the number and type of processors that are on your server. Also, consider the server’s physical memory and its current memory usage. Measure these when the server is under load so you can see the changes in items like memory usage. Microsoft provides a simple and free load tester called “Microsoft Web Application Stress Tool”. There is also OpenSTA. Use this to apply enough load to send your CPU usage to 100%. At this point, note the heap size, the amount of the heap being used, the physical memory usage and the number of full GCs. If the Tenured space is filling up quickly and the garbage collector is doing a full GC every few minutes, you have a problem. You do not want the Tenured space to fill up frequently. If this happens more than once an hour, you will most likely need to adjust your JVM.
How to Make the JVM Setting Changes
Changing the Heap size is very easy through the ColdFusion administrator.

The default settings are shown above. There is a strong argument to set
the Minimum and Maximum settings to the same size. The reason is that
it will keep the JVM from having to calculate this for itself, thereby
allowing the JVM to focus on more important things. But when you do
this, more attention will need to be given to the JVM to see if any java.lang.OutOfMemoryError errors appear in your exception logs.
How high can you increase the Heap size? This depends on the JVM version and hardware being used. You will need to do some research here. Most recent JVM’s on a 32-bit system usually have a limit near 2 GB. 64-bit systems can run much higher. If your server has only 2 GB of memory, then it would be safe to only go up to 1 GB for the JVM. Remember, your other applications need memory too.
You can actually lower your server’s performance by setting your Heap size too high. If, for example, your JVM never exceeds 100MB of memory, and yet you have the Heap size set to 1024MB, you are asking the garbage collector to manage a bigger memory space than it really needs to. Look at your Tenured space and see how often it fills up. If it rarely seems to fill up, then there is no reason to increase your Heap size. If you lower your Heap size, pay attention to your exception logs for java.lang.OutOfMemoryError errors because this will serve as a warning that the JVM is running out of memory.
The Permanent space size can also be controlled. This setting can be found in the JVM arguments section of the CF Admin. In the arguments, you should see something like this, “-XX:MaxPermSize=128m”, which simply. This argument simply tells the JVM that the maximum allocation of memory for the Permanent space is 128MB. Depending on what your ColdFusion application server is doing, it may be necessary to move this setting up to 192MB or 256MB. If your ColdFusion is creating a lot of class objects, then it may be necessary to move this limit up.
The garbage collector can also be changed and tuned. The default garbage collector used by ColdFusion 6 & 7 is called the Parallel Young Generation collector (or Parallel Scavenging) which is a part of the family of Throughput collectors. You will need to go directly to the jvm.config file to see its setting. Under the JVM arguments, you should see the following, “-XX:+UseParallelGC “. There are actually several others to choose from. The two major families are Low Pause Collectors and Throughput Collectors. The differences are in how they treat the balance between GC pauses versus processor performance. The Low Pause family of collectors will allow applications to run during part of the GC process. It does this by not to moving “live” objects when it’s removing dead objects from the Tenure space. This, however, costs the collector in performance since it has more complexity to its task. So Low Pause collectors give you smaller GC pauses but with more processor time than with the Parallel collectors. Throughput collectors have longer GC pauses but greater CPU throughput because the application threads are not sharing the processor time with the GC. Typically, applications with large real-time data prefer the Low Pause collectors, but you will need to see if you have the available processor resources to make this type of switch.
In summary, if you feel that the default collector is not very efficient, research the others available and test to see if they can help your system. Note, other JVMs sometimes carry with them other collectors. For example, the JRockit JVM from BEA has the Dynamic Garbage Collector, which is not available with Sun.
Finally, How and When to Optimized the JVM
In most cases, you do not want to see the Tenure space fill up very often because when it does the JVM has to run a full garbage collection, which takes up time and resources. Plus, you run the risk of the JVM not being able to flush out the memory in time and crashing your ColdFusion server. So adjust your JVM heap size to fit the needs of your system. If you want to switch out the garbage collector, I would advise you to do plenty of research. Sun has a lot of documentation on this subject, regarding this and O’Reilly has an excellent book called Java Performance Tuning by Jack Shirazi. As always, test any setting changes on a development server first before applying to a production environment.
As
you can see, the JVM settings are extremely powerful and can do a lot
to improve your ColdFusion application performance. My hope is that
this article encourages you to learn as much as you can about the JVM
and its settings. If you are interested in learning more about this and
our research, please visit http://labs.fusionlink.com for more
information.
Some additional links on this:
JVMstat
Sun Tuning Garbage Collection
Java Hotspot Options
ACFUG Powerpoint Presentation